Reasons why your 2014 Highlander A/C is consuming too much Gas
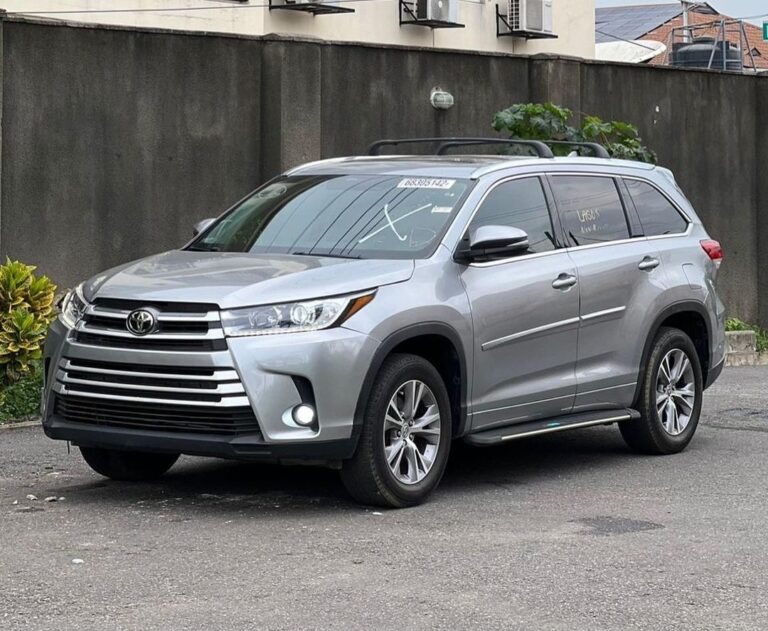
Highlander is one of the products that is been owned by Toyota. The 2014 Highlander is a good choice for people with large families. It’s a big SUV that gives quality interior materials, a smooth ride, and seating for up…